
The React useDebugValue Hook

The React useDebugValue hook offers a way to display custom debugging information for custom hooks within React DevTools. Learn how to use it.
A key tool in the React ecosystem for debugging and inspecting component hierarchies is React DevTools. In this context, we’ll delve into a specific feature within React DevTools—an extension available for Chrome, Firefox and Edge browsers that provides a deep dive into the component trees of React applications.
In this article, we’ll see how the useDebugValue hook allows developers to add custom labels to their custom hooks, making these values visible in React DevTools and simplifying the debugging process.
React DevTools
React DevTools is an extension that integrates directly into popular browsers. It enables developers to inspect the props, state, context and hooks of React components in real time, significantly improving the debugging process.
Assume we had a small React application that utilizes a custom hook named useCounter to manage state related to a counter. The useCounter hook initializes a count state with an optional initial value and provides an increment function to update this count. The App component renders a heading displaying the current count and a button that, when clicked, increments the count.
import React from 'react';

function useCounter(initialValue = 0) {
  const [count, setCount] = React.useState(initialValue);
  const increment = () => setCount((prevCount) => prevCount + 1);
  return [count, increment];
}

function Heading({ count }) {
  return <h1>Count: {count}</h1>;
}

function Button({ text, onClick }) {
  return <button onClick={onClick}>{text}</button>;
}

export default function App() {
  const [count, increment] = useCounter(0);

  return (
    <div>
      <Heading count={count} />
      <Button text="Click Me!" onClick={increment} />
    </div>
  );
}
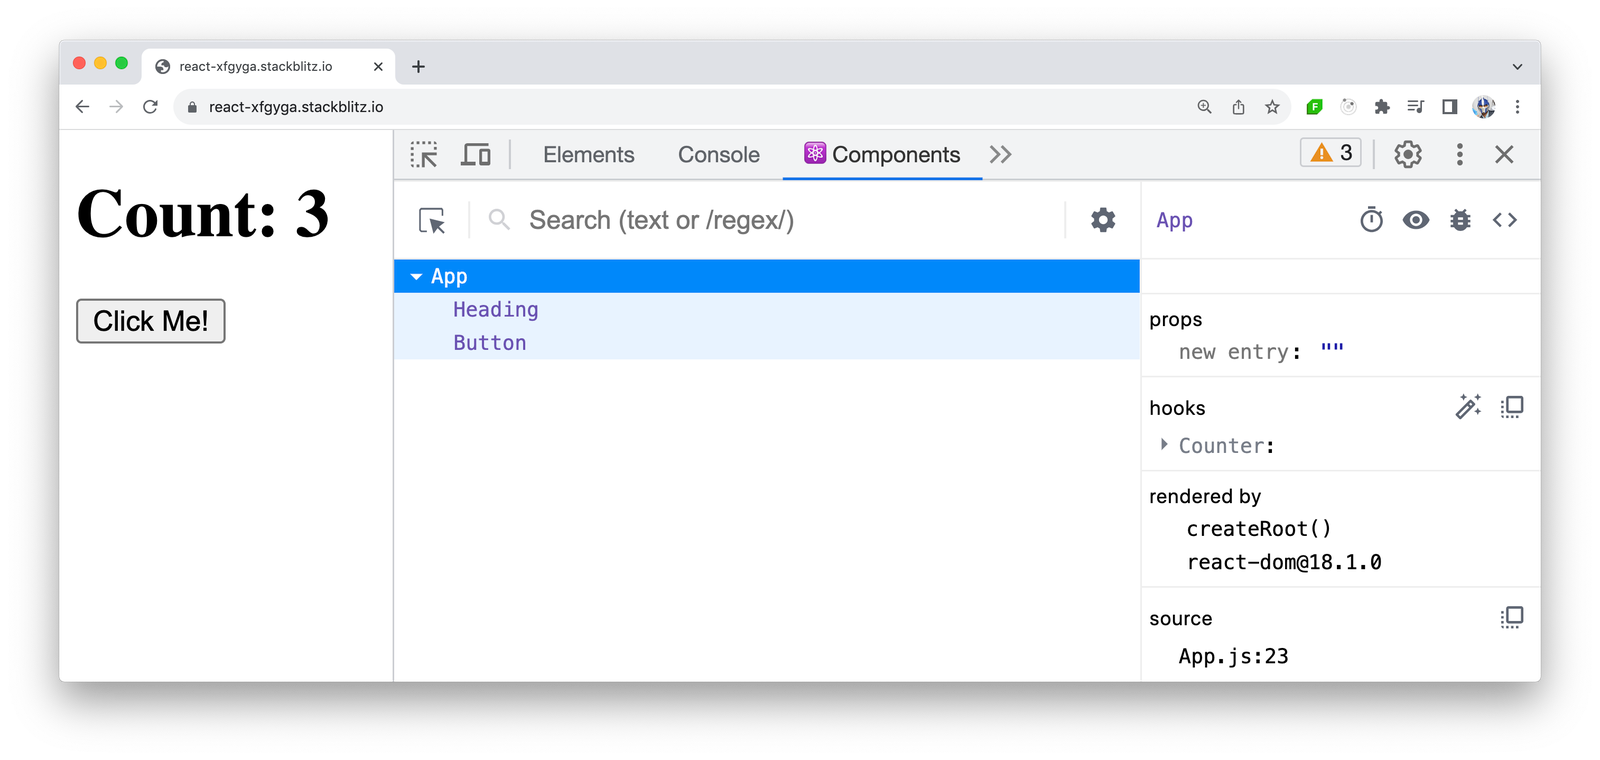
With React DevTools, we’ll be able to inspect the current state and behavior of the useCounter hook directly within the component tree. This visibility can be critical for debugging, as it provides insight into how custom hooks manage state and interact with other components in an application.
useDebugValue
The useDebugValue hook offers developers a way to display custom debugging information for custom hooks within React DevTools. This feature is particularly useful for library authors and developers who create and use custom hooks in their applications. It provides a clearer understanding of what’s happening inside a hook, making debugging more straightforward.
To use useDebugValue, we can simply invoke it within a custom hook, passing in the value we want to debug. For example, in our useCounter hook, let’s assume we want to display the current count value in React DevTools to make it easier to debug the hook’s internal state. We can achieve this by adding a call to useDebugValue inside the useCounter hook:
import React from 'react';

function useCounter(initialValue = 0) {
  const [count, setCount] = React.useState(initialValue);

  // Displaying count value in React DevTools
  React.useDebugValue(`Count: ${count}`);

  const increment = () => setCount((prevCount) => prevCount + 1);
  return [count, increment];
}
In this modified version of the useCounter hook, useDebugValue is used to provide a custom debug value (Count: ${count}) that will appear in React DevTools.
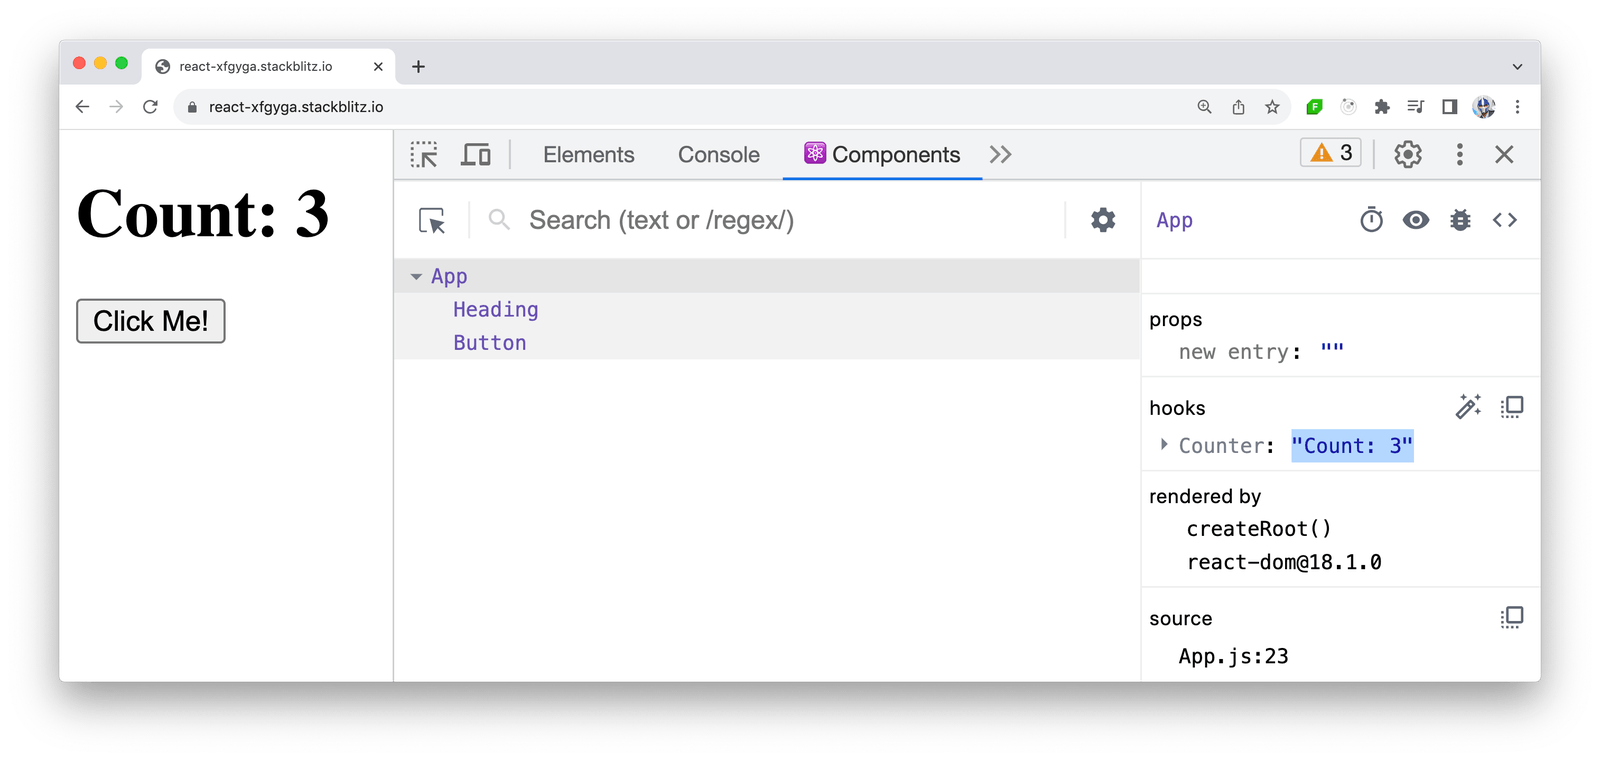
By utilizing the useDebugValue hook, developers can greatly simplify the debugging process for custom hooks by making internal states and behaviors easily visible within React DevTools.
Formatting with a Function
The useDebugValue hook goes a step further by allowing the passing of a formatting function as its second argument. This function receives the debug value as a parameter and returns a formatted display value. This is particularly useful when the debug value is complex or needs to be presented in a more readable or informative manner.
As an example, consider a custom hook that manages date values. The raw state might be a JavaScript Date object, which is not immediately clear when viewed as a debug value. By providing a formatting function, we can display the date in a more human-readable format.
Here’s how we could implement something like this:
import React from 'react';

function useFormattedDate(date = new Date()) {
  const [currentDate, setCurrentDate] = React.useState(date);

  // Use the useDebugValue Hook with a formatting function
  React.useDebugValue(currentDate, date => date.toISOString());

  return [currentDate, setCurrentDate];
}

export default function App() {
  const [currentDate] = useFormattedDate();

  return (
    <div>
      <h1>Current Date: {currentDate.toISOString()}</h1>
    </div>
  );
}
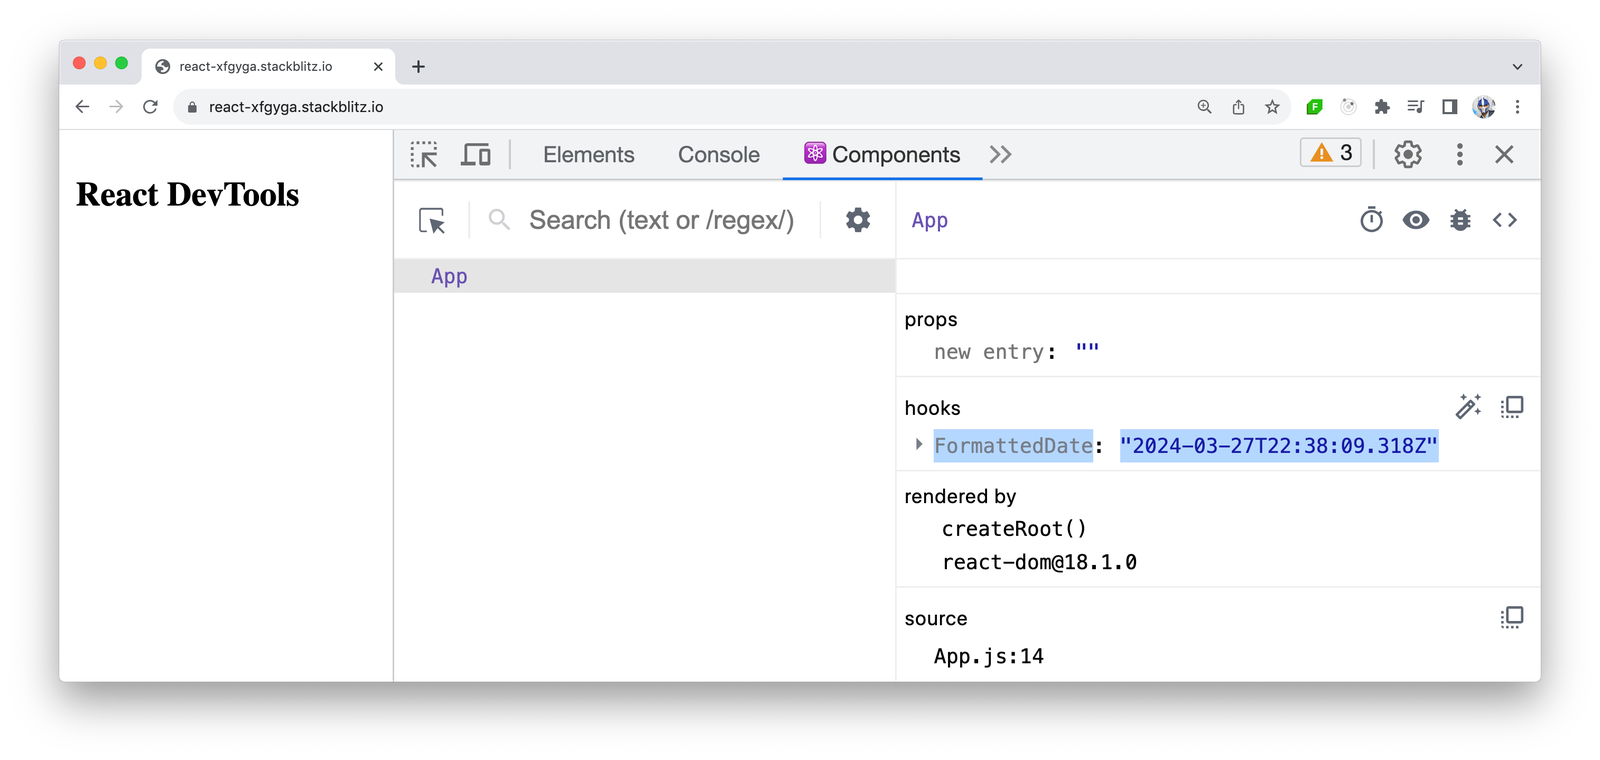
In the above example, useDebugValue is used within the useFormattedDate hook to display the current date. However, instead of showing the Date object directly, it uses a formatting function (date => date.toISOString()) to convert the date into an ISO string. This makes the debug information more accessible and useful, especially when quickly scanning through React DevTools.
Wrap-up
The useDebugValue hook offers a straightforward and efficient way for developers to add readable, meaningful debug information directly within React DevTools for their custom hooks. Moreover, the optional use of a formatting function with the useDebugValue hook allows for the customization of how debug values are displayed, offering flexibility in handling various data types and structures.
For more details on the useDebugValue hook, be sure to read through the official React documentation.

Hassan Djirdeh
Hassan is a senior frontend engineer and has helped build large production applications at-scale at organizations like Doordash, Instacart and Shopify. Hassan is also a published author and course instructor where he’s helped thousands of students learn in-depth frontend engineering skills like React, Vue, TypeScript, and GraphQL.
Related Posts
Comments
All articles
Topics

Latest Stories
in Your Inbox
Subscribe to be the first to get our expert-written articles and tutorials for developers!
All fields are required