
Vue Basics: Deep Dive into Vue Devtools

Let’s explore Vue Devtools, its role in application development and how it can be harnessed to streamline debugging and state management in Vue applications.
Vue.js, a progressive JavaScript framework, is celebrated for its simplicity and flexibility in building interactive user interfaces. Integral to Vue’s ecosystem is a powerful tool that significantly enhances development workflows: Vue Devtools. This browser extension offers developers a comprehensive suite of features to inspect, debug and optimize their Vue applications more efficiently.
In this article, we’ll embark on an exploration of Vue Devtools, highlighting its role in application development and how it can be harnessed to streamline debugging and state management in Vue applications.
Vue Devtools
Vue Devtools is a browser extension that serves as a bridge to our Vue application, allowing us to inspect components, track state changes and observe events in real time. With its user-friendly interface, Vue Devtools demystifies the internals of a Vue application, making it a helpful tool for both novice and experienced Vue developers.
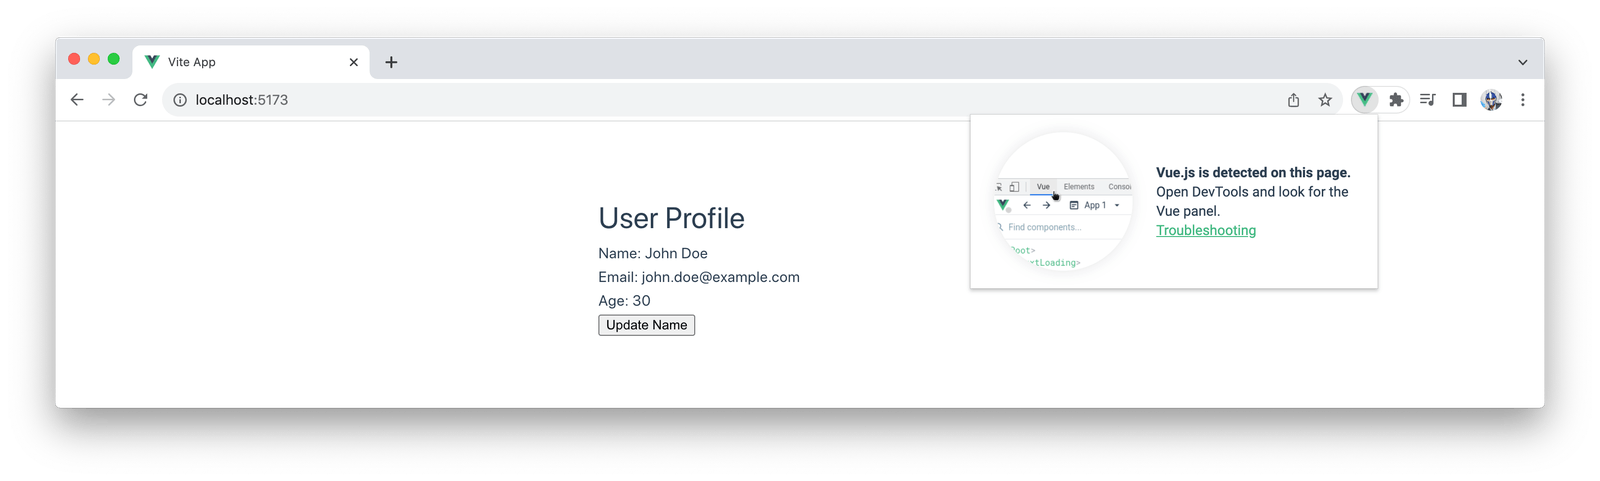
Getting started with Vue Devtools is straightforward. You can install either the extension from the Chrome Web Store, Firefox Add-ons, Edge Add-ons or as a standalone app. Once installed, the Vue logo will appear in your browser’s extension tray, indicating that Vue Devtools is ready to use on any site running Vue.js.
Inspecting and Modifying Component State
One of the core functionalities of Vue Devtools is the ability to inspect and modify the state of Vue components in an application. Suppose we have a UserProfile component defined in our Vue application like so:
<template>
  <div>
    <h1>User Profile</h1>
    <p>Name: {{ userProfile.name }}</p>
    <p>Email: {{ userProfile.email }}</p>
    <p>Age: {{ userProfile.age }}</p>
  </div>
</template>

<script setup>
  import { ref } from "vue";
  const userProfile = ref({
    name: "John Doe",
    email: "john.doe@example.com",
    age: 30,
  });
</script>
In the above component, we define a simple Vue application component using the Composition API with the <script setup> syntax. This component, named UserProfile, displays user information, including name, email and age, which are stored in a reactive object named userProfile created with the ref function from Vue’s reactivity system.
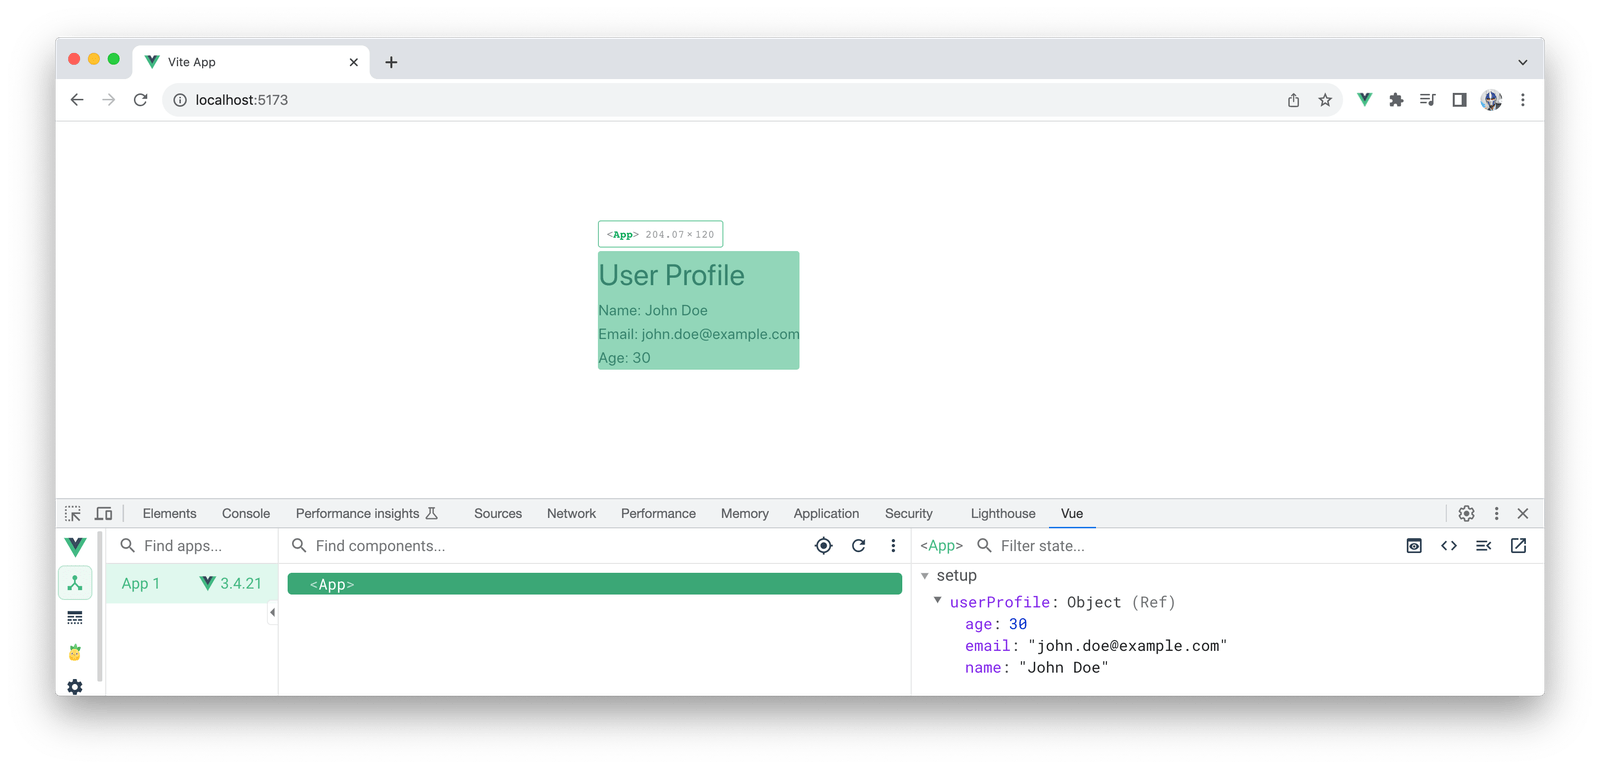
In Vue Devtools, we can navigate to the “Components” tab to see a hierarchical view of our application’s component structure. Clicking on the UserProfile component within this tree will allow us to inspect its current state. Specifically, in the right panel of Vue Devtools, under the “State” section, we’ll find the userProfile object. This section displays the reactive data properties (name, email and age) associated with the UserProfile component.
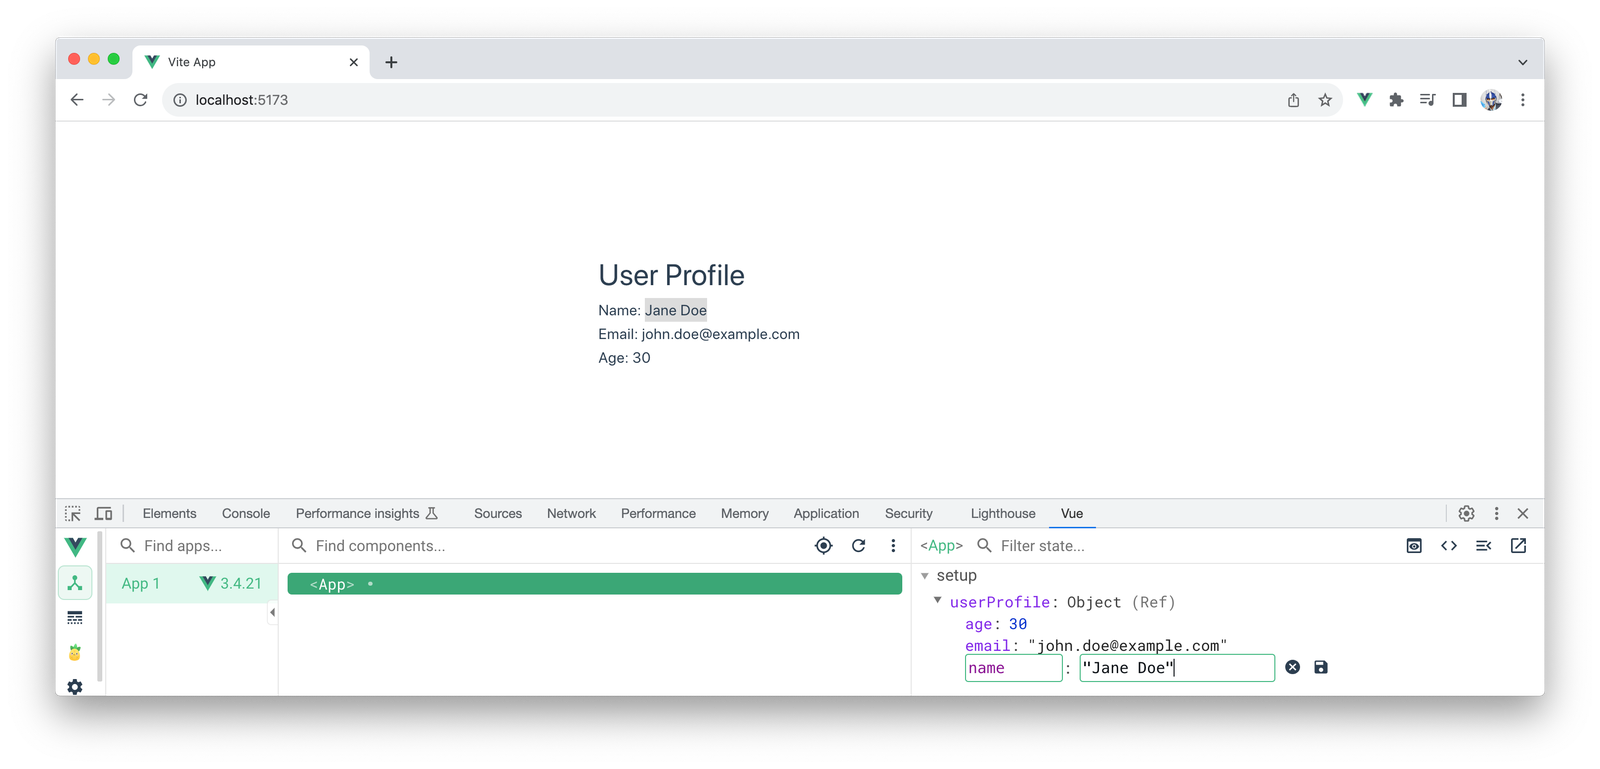
In Vue Devtools, we can directly modify the values of a component’s properties (e.g., changing the name from “John Doe” to “Jane Doe”) by clicking on the value next to each property name and typing in a new value. Once we press Enter, the application’s interface will immediately update to reflect this change, showcasing the reactive power of Vue and the utility of Vue Devtools for debugging and development purposes.
Event Tracking
Event tracking in Vue Devtools is a vital feature for debugging and understanding the behavior of Vue applications, especially when dealing with complex interactions and data flow. The “Timeline” tab provides a visual representation of the events that occur during the lifecycle of the application, including component updates, Pinia mutations and custom events.
Let’s consider an example where we want to track a custom event emitted by the UserProfile component whenever the user updates their profile information. We’ll modify the UserProfile component to emit a custom event named profileUpdated whenever the user’s profile data changes. We’ll also introduce a method to simulate updating the user’s name.
<template>
  <div>
    <h1>User Profile</h1>
    <p>Name: {{ userProfile.name }}</p>
    <p>Email: {{ userProfile.email }}</p>
    <p>Age: {{ userProfile.age }}</p>
    <button @click="updateName">Update Name</button>
  </div>
</template>

<script setup>
  import { ref } from "vue";
  const userProfile = ref({
    name: "John Doe",
    email: "john.doe@example.com",
    age: 30,
  });

  const emit = defineEmits(["profileUpdated"]);
  function updateName() {
    userProfile.value.name = "Jane Doe";
    emit("profileUpdated", { newName: userProfile.value.name });
  }
</script>
In this enhanced component, a button labeled “Update Name” calls the updateName() method when clicked, updating the user’s name to “Jane Doe” and emitting the profileUpdated event.
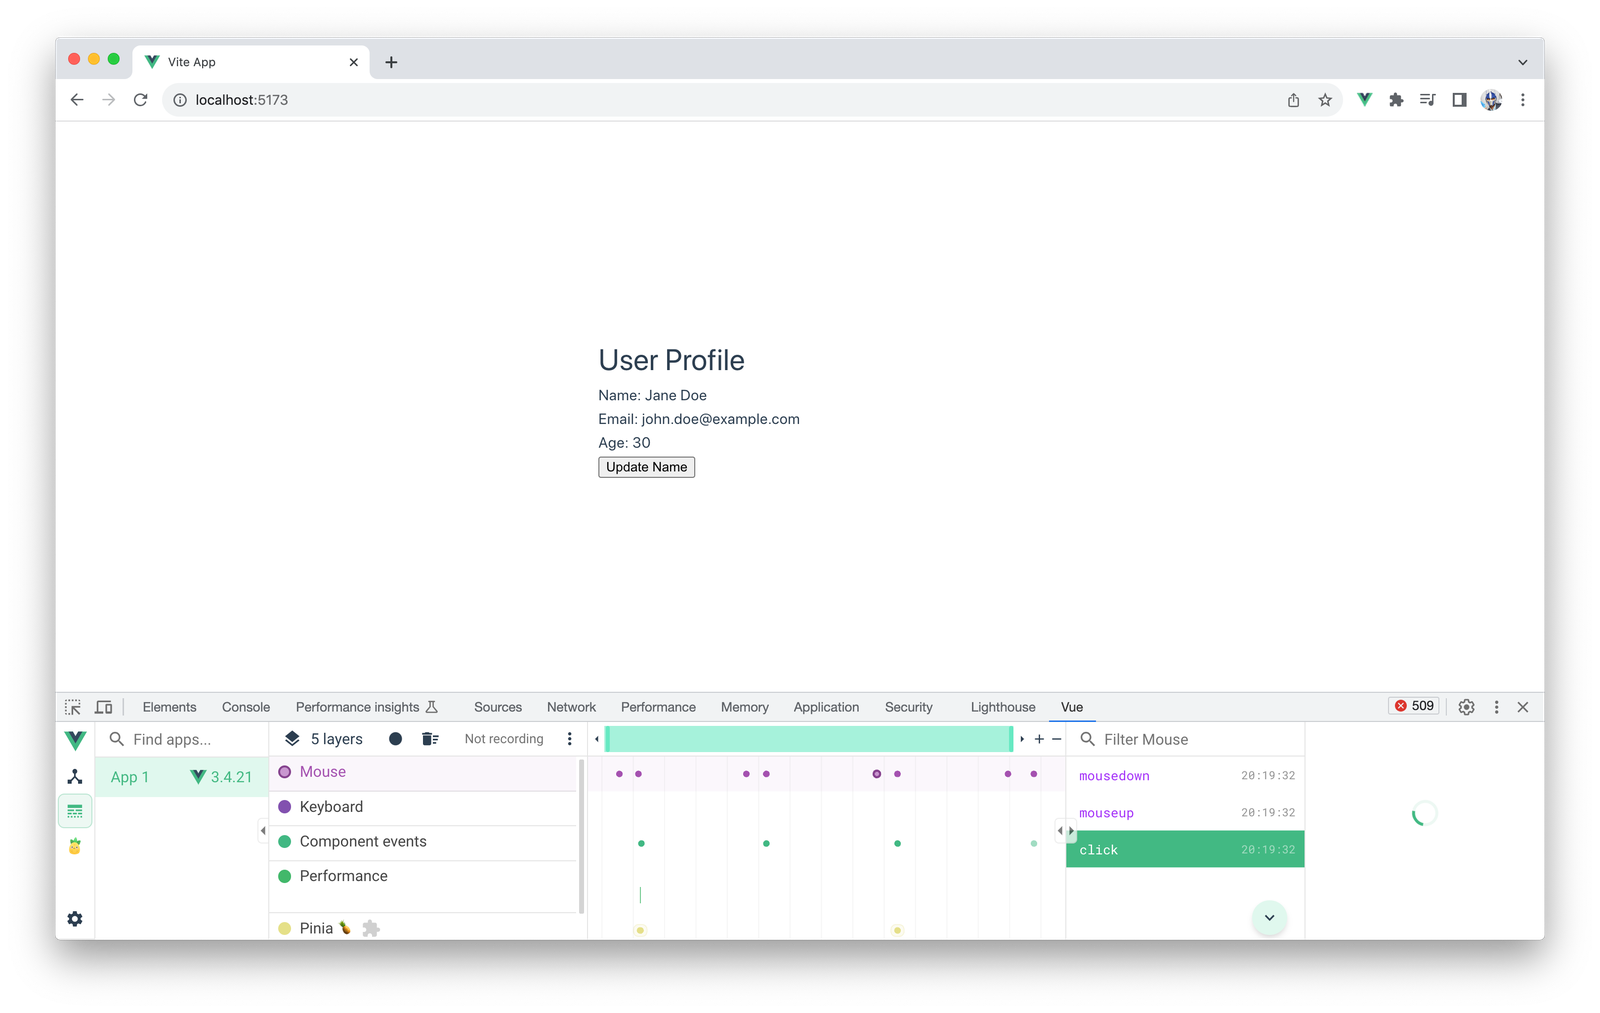
To track the event when it occurs in the Vue app, we can navigate to the “Timeline” tab of Vue Devtools. We can select the “Record” button to start capturing events and click the “Update Name” button in the UserProfile component to trigger the profileUpdated event. We’ll then see an entry for each profileUpdated event emitted. Clicking on a specific event log will reveal details about it, including the timestamp and the payload, which in this case includes the new name (Jane Doe).
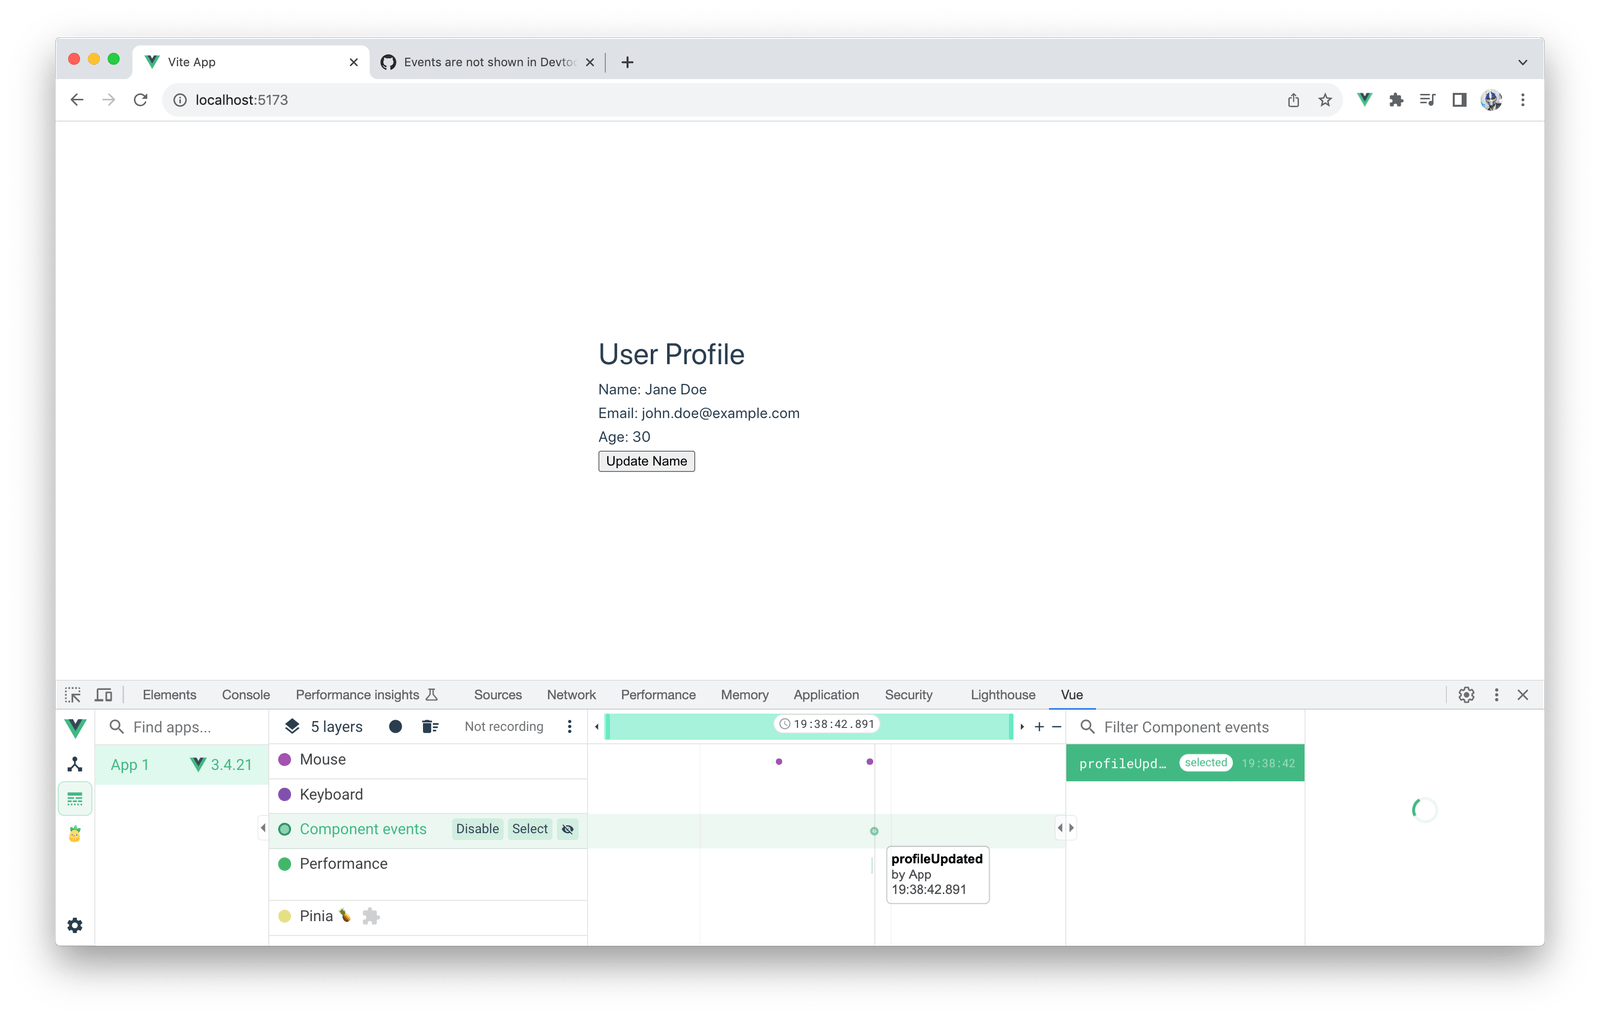
In addition to capturing custom events like profileUpdated, Vue Devtools also monitors and records user interactions such as mouse clicks and keyboard inputs. This functionality allows developers to see how UI events are triggered and handled, which is invaluable for debugging user experience issues or for understanding the interaction flow within the application.
Performance Profiling
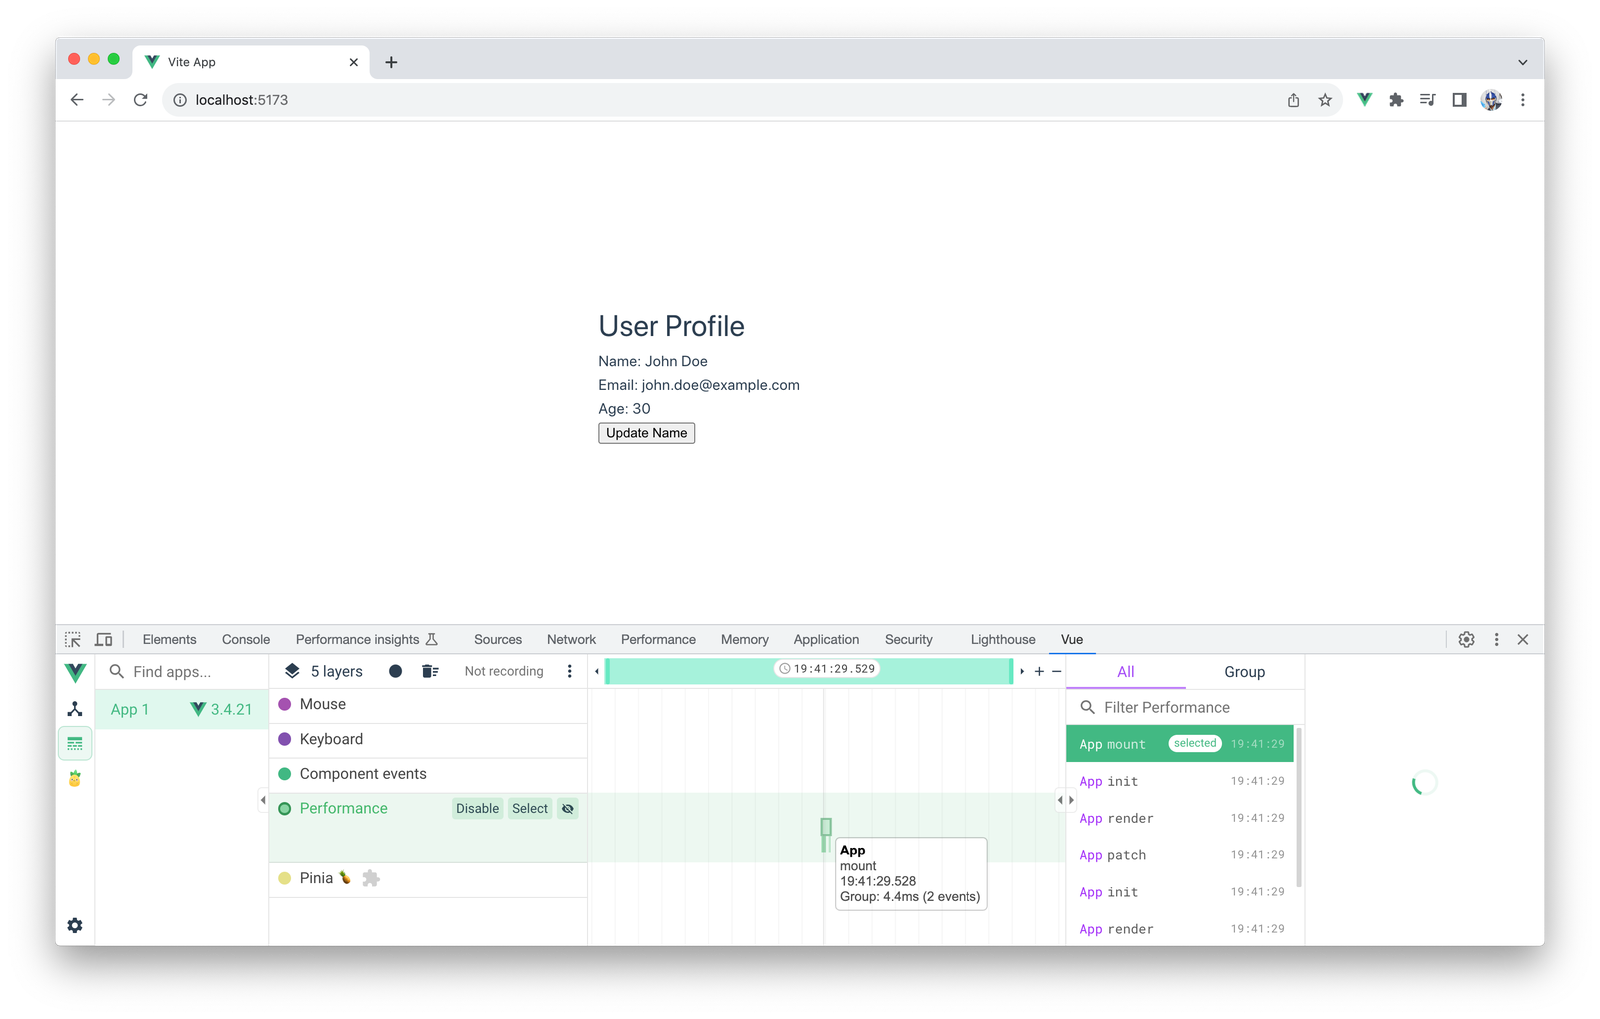
Optimizing application performance is crucial for a smooth user experience. Vue Devtools aids in this endeavor with its performance profiling features. Under the “Timeline” tab, we can also record and analyze our application’s performance, identify bottlenecks and get insights into component render times and event handling performance.
For our UserProfile component, performance tracking can show a series of events that relate to the initial rendering lifecycle of the Vue application with timestamps, including App mount, App init, App render and App patch.
Time-Travel Debugging
Time-travel debugging is an innovative feature in Vue Devtools that allows us to step back and forth through the state changes of an application. This is incredibly powerful when combined with a state management library like Pinia, which provides a centralized store for all the components in your Vue application.
Let’s take our UserProfile component and integrate it with Pinia to see how time-travel debugging can be utilized. Firstly, we will set up a Pinia store that holds the state for our UserProfile component.
// store/userProfile.js
import { defineStore } from "pinia";

export const useUserProfileStore = defineStore("userProfile", {
  state: () => ({
    name: "John Doe",
    email: "john.doe@example.com",
    age: 30,
  }),
  actions: {
    updateName(newName) {
      this.name = newName;
      // This mutation will be trackable by Vue DevTools
    },
  },
});
We’ll then modify our UserProfile component to use the Pinia store instead of a local state.
<template>
  <div>
    <h1>User Profile</h1>
    <p>Name: {{ user.name }}</p>
    <p>Email: {{ user.email }}</p>
    <p>Age: {{ user.age }}</p>
    <button @click="updateName('Jane Doe')">Update Name</button>
  </div>
</template>

<script setup>
  import { useUserProfileStore } from "./stores/userProfile";

  const store = useUserProfileStore();
  const user = store.$state;

  const emit = defineEmits(["profileUpdated"]);
  const updateName = (newName) => {
    store.updateName(newName);
    emit("profileUpdated", { newName: store.name });
  };
</script>
With Pinia integrated, every time the state changes (like when the updateName() action is called), Vue Devtools will log the mutation. In the “Timeline” tab, we can then click on the individual mutations to navigate through time. The application’s state will update to reflect the store’s state at each mutation, effectively traveling through time.
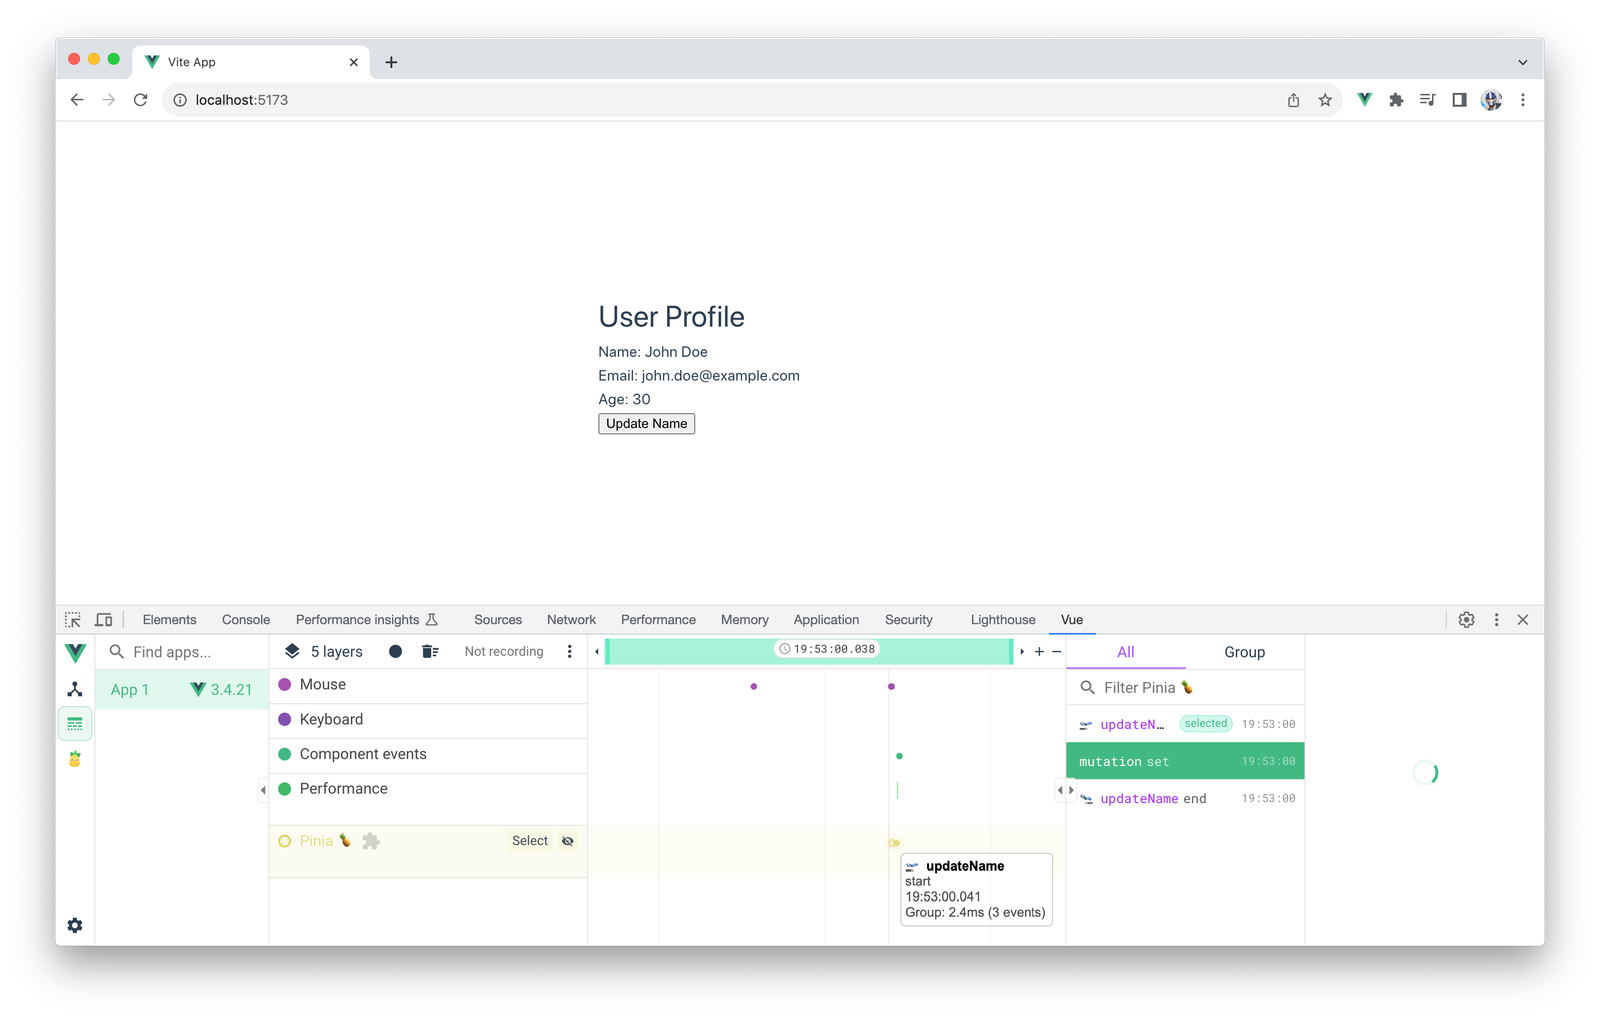
With this setup, we can observe how state changes propagate through our application and easily pinpoint when and why a particular state is not what you expect.
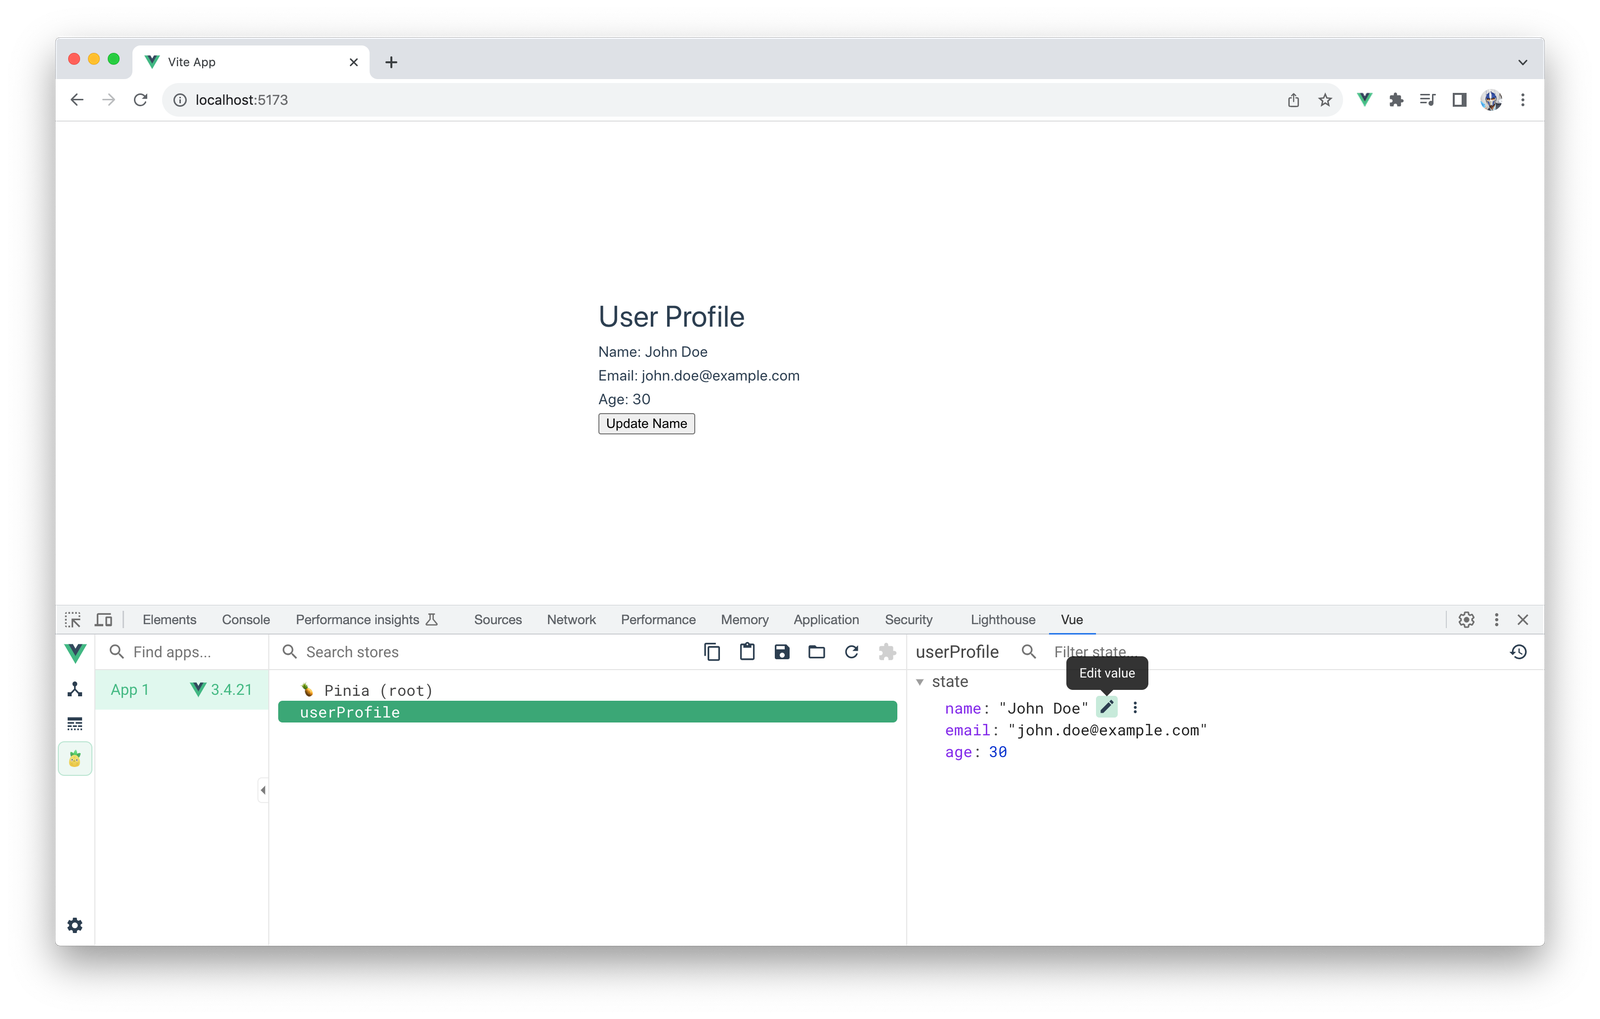
Vue Devtools also allows us to visit a “Pinia” tab to inspect and interact with the state of a Pinia store directly.
Wrap-up
Vue Devtools is an essential instrument in the Vue developer’s toolkit, offering deep insights into application structure, state management and performance. Here are some tips to keep in mind to maximize its potential:
- Use the filter capability to narrow down components or events, making it easier to focus on specific parts of your application.
- Copy Pinia state as JSON for sharing. Employ the feature in the “Pinia” tab that allows you to copy the store state as JSON, facilitating the process of sharing state snapshots with team members or replicating states during testing.
- Regularly check the “Performance” tab to catch and address performance issues early in the development process. A proactive approach can help prevent small issues from turning into larger problems.
By leveraging Vue Devtools to its full potential, developers can enhance their productivity, streamline debugging processes, and deliver optimized Vue applications. For more information and advanced usage, be sure to explore the official Vue Devtools documentation!

Hassan Djirdeh
Hassan is a senior frontend engineer and has helped build large production applications at-scale at organizations like Doordash, Instacart and Shopify. Hassan is also a published author and course instructor where he’s helped thousands of students learn in-depth frontend engineering skills like React, Vue, TypeScript, and GraphQL.
Related Posts
Comments
All articles
Topics

Latest Stories
in Your Inbox
Subscribe to be the first to get our expert-written articles and tutorials for developers!
All fields are required